Google Already Scored Your Site. Did You Check?
Google measures your site whether you look at the report or not. Core Web Vitals have been a confirmed ranking factor since 2021 — not a future consideration, not a nice-to-have, not a thing your developer will "get to eventually." They run in the background of every page load, scoring how your site performs for real users on real devices.
Most WordPress site owners know the term. Very few understand what's actually being measured. And the ones who do often assume a fast-loading homepage means they're fine. It doesn't.
This isn't a beginner's guide to web performance. If you own a WordPress site and care about organic rankings, this is the breakdown you actually need — what each metric means under the hood, where WordPress specifically fails them, and what it costs to ignore the numbers.
The Three Metrics That Actually Matter (And One That Changed)
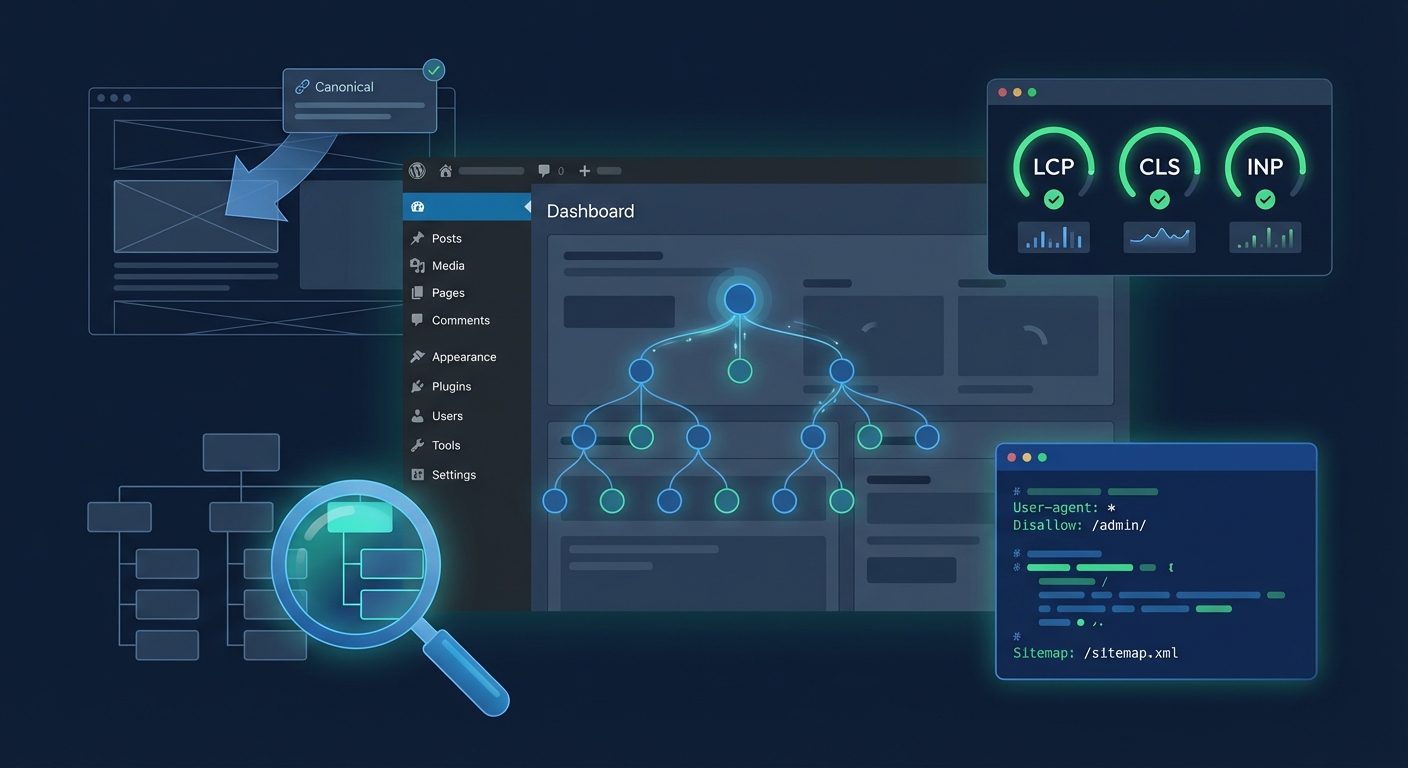
Google's Core Web Vitals framework originally had three metrics: LCP, FID, and CLS. In March 2024, FID was officially replaced by INP. If you've been optimizing for FID, you've been solving yesterday's problem.
Here's what you're actually being scored on:
LCP — Largest Contentful Paint
What it measures: How long it takes for the largest visible element on the page to render. That's usually a hero image, an above-the-fold banner, or a large heading block.
Target: Under 2.5 seconds.
Why WordPress struggles with it: LCP failures on WordPress sites almost always come from the same cluster of problems. Render-blocking JavaScript from plugins queuing scripts before the DOM loads. Unoptimized hero images served without lazy-loading deferrals or next-gen formats like WebP or AVIF. External font loads from Google Fonts or Adobe Typekit that pause rendering by default until the font file resolves. Theme frameworks that output 8–12 separate CSS files instead of one compiled stylesheet — each one is a blocking request the browser has to resolve before it can paint anything.
When you run wp post list --post_status=publish and there are thousands of posts, some with thumbnail images that were never compressed on upload, every one of those pages carries an LCP risk. Image optimization isn't just a "media library housekeeping" task — it's a ranking variable on every single URL you've published.
One more often-overlooked LCP culprit: Time to First Byte (TTFB). Your server has to respond before the browser can render anything. A slow server response — caused by a congested hosting environment, a bloated WordPress bootstrap process, or a missing page cache — adds directly to LCP before a single asset has loaded. Shared hosting environments under heavy load regularly produce TTFB above 600ms, which makes a sub-2.5s LCP nearly impossible to achieve regardless of other optimizations.
INP — Interaction to Next Paint
What it measures: How quickly the page responds when a user interacts — a click, a form submit, a tap. It replaced FID because FID only measured the first interaction delay. INP captures responsiveness across the entire session, which is a much stricter — and more honest — signal of real user experience.
Target: Under 200 milliseconds.
Why WordPress struggles with it: This one is almost entirely a JavaScript problem. Most WordPress sites carry 15–25 active plugins, and most of those plugins load JavaScript globally — on every page, regardless of whether that script does anything meaningful on that page. A contact form plugin loading its validation scripts on your homepage. A WooCommerce cart fragment script running on a static blog post. A page builder outputting inline scripts and event listeners on pages that don't use any interactive elements.
The result is a main thread so congested that click events queue behind rendering tasks. Users tap a button and nothing happens for 300–500ms. That registers as an INP failure, and Google records it directly from real Chrome users via the Chrome User Experience Report (CrUX). You don't get to dispute those numbers with a lab score.
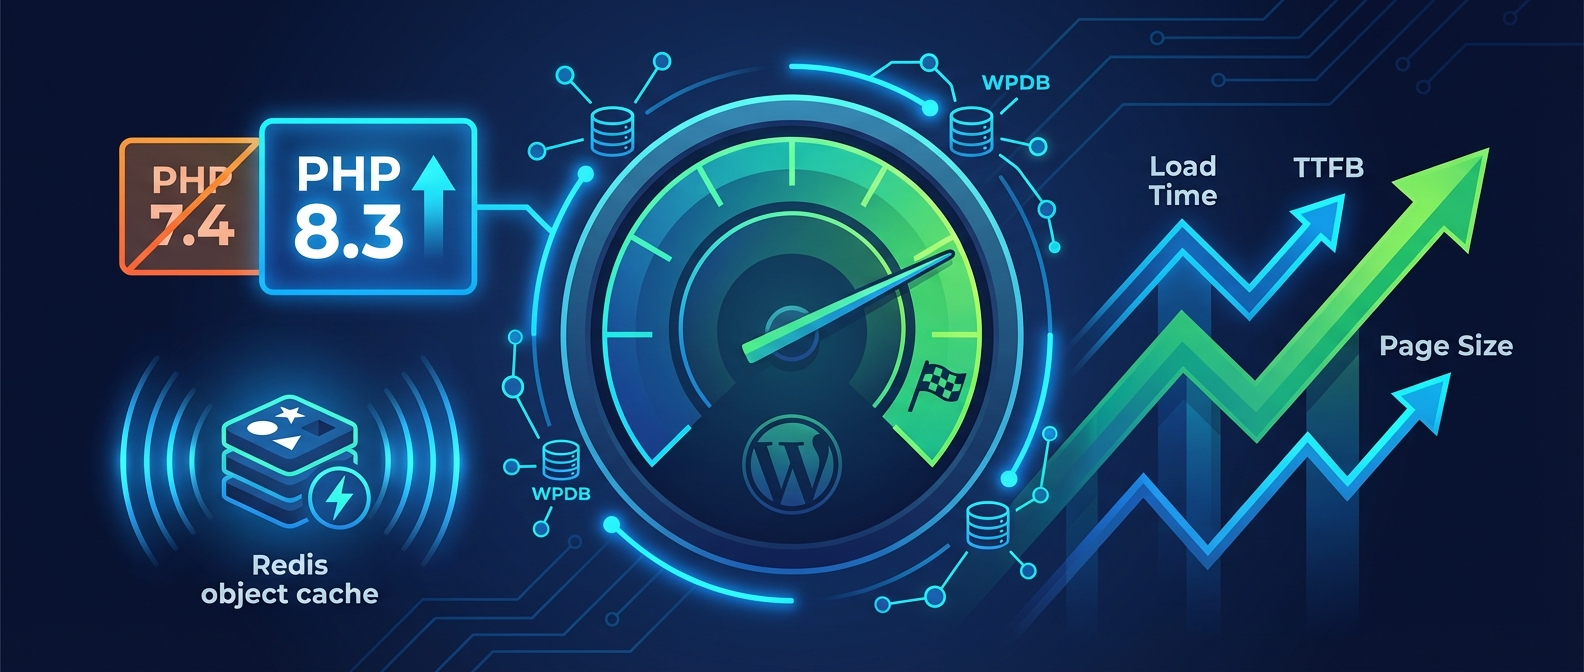
This is also where object caching becomes critical. Sites without a persistent object cache — Redis or Memcached wired in through wp-config.php — force PHP to rebuild page state on every single request. That CPU overhead compounds JavaScript latency. If you're unsure whether your object cache is active, check for the drop-in at wp-content/object-cache.php. If it's not there, you're leaving significant performance on the table.
CLS — Cumulative Layout Shift
What it measures: How much the page layout shifts unexpectedly while loading. Images without declared dimensions. Late-loading ads that push content down. Web font swaps that cause text reflow. Third-party embeds that render after surrounding content has already painted.
Target: Under 0.1.
Why WordPress struggles with it: Classic block themes and most page builders don't natively reserve space for images, embeds, or dynamic content. Every time a plugin or theme outputs an image without explicit width and height attributes, the browser cannot pre-allocate the space in the layout — so when the image loads, everything below it shifts.
Ad networks are a frequent CLS source. Header bidding scripts load asynchronously and inject ad containers at different sizes than their reserved placeholders. If you're running any ad management plugin without fixed dimensions locked to each placement, you're generating CLS on the pages that drive the most revenue — the ones with the highest ad density.
WooCommerce cart fragments contribute in a subtler way. The wc-cart-fragments.js script fires an AJAX request on every page load to update cart counts in the header. If header elements don't have fixed dimensions defined in CSS, those updates can trigger small but measurable layout shifts. Across thousands of page views in a 28-day CrUX window, small shifts accumulate into a visible CLS score problem.
The WordPress-Specific Failure Patterns Nobody Talks About Enough
Core Web Vitals failures don't happen because WordPress is inherently slow. They happen because WordPress sites accumulate technical debt in specific, predictable ways — and most owners don't have the visibility to see it until rankings move.
Pattern 1: The wp_options bloat trap. When autoloaded data in wp_options exceeds 800KB–1MB, every PHP request that bootstraps WordPress pulls that entire payload from the database. Transients that were never cleaned. Plugin settings from deactivated plugins that were never fully uninstalled. Theme mods from a theme you stopped using two years ago. That database overhead adds 100–400ms to server response time before the browser has received a single byte of HTML — which directly damages LCP.
A single SQL query surfaces this immediately: SELECT SUM(LENGTH(option_value)) FROM wp_options WHERE autoload = 'yes'. If the result exceeds 800KB, you have a bloat problem that no caching plugin will fully compensate for.
Pattern 2: PHP version lag. PHP 8.2 performs measurably faster than PHP 7.4 on most WordPress workloads — benchmarks consistently show 20–40% throughput improvements in PHP 8.x over 7.x. Sites still running PHP 7.x carry a performance penalty baked into every request. The common blocker is plugin compatibility — some plugin developers lag behind PHP releases, and site owners avoid the upgrade out of fear of breakage. That's a legitimate concern without a staging workflow in place. But it's also a real cost: slower response times, worse LCP, degraded INP.
Pattern 3: Cron job accumulation. WordPress's built-in wp-cron fires on page load. Sites with dozens of scheduled events — backup plugins, SEO crawlers, cache purgers, uptime monitors — can trigger multiple concurrent cron executions during high-traffic periods. The result is random spikes in server response time that appear as LCP regressions in field data. Run wp cron event list and you'll almost always find a backlog nobody has looked at in months.
Pattern 4: Query Monitor diagnostics ignored. Most performance-aware WordPress owners have run Query Monitor at some point. Few maintain the habit. Slow database queries, missing database indexes, and N+1 query patterns from poorly written plugins surface clearly in Query Monitor output. A page generating 150+ queries from a theme that calls get_post_meta() inside a loop — without proper object caching to absorb the repetition — can add 400–600ms to server response time, making a strong LCP score structurally impossible regardless of what the CDN does downstream.
What the Scores Actually Cost
Core Web Vitals sit inside Google's Page Experience signal, which feeds organic ranking calculations. Google hasn't released a direct conversion table between CWV scores and ranking positions — nobody has — but the SEO industry consensus is consistent: sites with "Good" CWV scores across all three metrics hold a measurable ranking advantage in competitive SERPs, particularly in verticals where multiple sites offer comparable content quality.
More directly: slow sites convert worse. This isn't a ranking abstraction. A WooCommerce store averaging $5,000/day in revenue that loads 1.5 seconds slower than a competitor's site loses real sales to that performance gap. Google's own research suggests each additional second of load time increases bounce rate by 32%. That bounce rate feeds engagement signals. Engagement signals influence rankings. It compounds.
For content sites running display advertising, session depth drives page RPM. Users who experience high CLS or poor INP are less likely to scroll past the fold. Fewer pageviews per session means less ad exposure. The Core Web Vitals failure isn't only a ranking story — it's a revenue story with a direct line to the bottom.
The Fix Isn't a Plugin Install
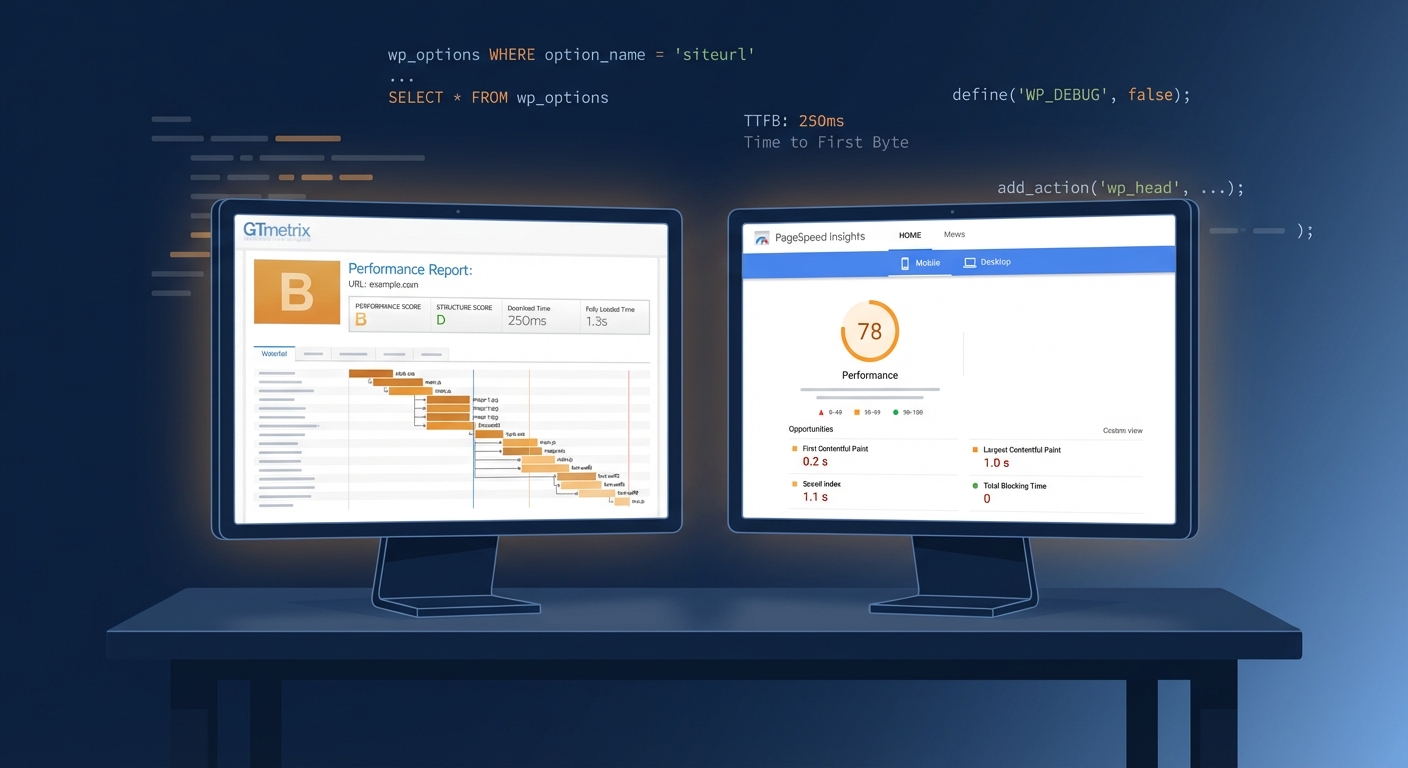
This is where most optimization advice breaks down. You can install a caching plugin, a minification tool, an image optimizer, and a CDN — and still fail Core Web Vitals. Because the metrics measure real user experience, not benchmark scores. A synthetic GTmetrix report showing 95/100 can coexist with failing CrUX data if your plugin stack generates JavaScript that degrades interaction responsiveness for actual users in the field.
Fixing Core Web Vitals on WordPress requires a diagnosis-first approach:
-
Separate lab data from field data. PageSpeed Insights shows both. The field data (from CrUX) is what Google uses for rankings. The lab data (Lighthouse) is diagnostic. They tell different stories and require different responses.
-
Audit JavaScript loading behavior. For every active plugin, identify whether it loads scripts globally or conditionally.
wp plugin listvia WP-CLI surfaces your full stack, but you'll need a profiler to trace per-plugin script output by URL. -
Check autoloaded wp_options. Run the SQL query above. If you're above 800KB, clean expired transients, remove orphaned plugin settings, and evaluate what's being autoloaded unnecessarily.
-
Validate your object cache setup. If you're not sure Redis or Memcached is active,
wp cache flushcombined with checkingwp-config.phpforWP_CACHEand verifying the drop-in atwp-content/object-cache.phpwill give you a clear picture. -
Test PHP version upgrades in staging. Any PHP version bump needs to run through a full functional regression before touching production. CWV regressions from a bad deploy can take weeks to recover in the 28-day CrUX window.
This is the kind of systematic work a proper WordPress performance audit covers. If you want to see exactly where your site stands, our Performance Pulse audit maps every one of these failure patterns against your specific configuration — with actionable remediation steps, not generic recommendations.
What Ongoing Optimization Actually Looks Like
Core Web Vitals aren't a one-time fix. CrUX data rolls on a 28-day window. A plugin update that introduces a render-blocking script can degrade your LCP score within weeks. A theme update that strips explicit image dimensions will visibly impact your CLS. Scores drift — constantly — and without monitoring, you won't know until you check Search Console and see a red bar where green used to be.
Sustainable Core Web Vitals performance on WordPress requires:
- Monthly field data monitoring, not just running PageSpeed when something feels slow
- Auditing plugin script output after major updates
- Keeping PHP current with staging coverage before version bumps
- Managing transient accumulation and autoloaded
wp_optionsas part of routine maintenance - Responding to CWV regressions before they compound into ranking movement
If you want a complete maintenance checklist that covers performance monitoring alongside security, backups, and update management, the Vimsy WordPress maintenance checklist is a practical starting point. For ongoing technical oversight built into a managed service, see what's included in each plan — and choose the tier that matches how much your site's performance actually costs you when it slips.
The Honest Bottom Line
Core Web Vitals aren't complicated in concept. They measure load speed, interactivity, and layout stability. What makes them difficult is that WordPress, in its default state, works against all three. Plugin accumulation, wp_options bloat, unmanaged cron jobs, absent object caching, PHP version debt — these aren't edge case problems. They're the default state of most production WordPress sites that haven't had sustained professional attention.
You can read every optimization guide published, configure a performance plugin stack, and still find your CrUX data sitting in the "Needs Improvement" band — because fixing Core Web Vitals on WordPress isn't a settings problem. It's a systems problem. And systems problems don't resolve with a one-time plugin install.
Look — I'm writing this because this is a problem I see constantly, and it's also exactly what we built Vimsy to solve. If you want professionals handling this instead of hoping nothing breaks, book a free call.
Your CrUX data is already accumulating. The question is whether it's moving in the right direction.