How to Test Your WordPress Site Speed (And What the Results Actually Mean)
You've run a speed test. You got a score. Now what?
Most site owners stare at a wall of red metrics — LCP, TBT, CLS, TTFB — and walk away either relieved they hit 70 or convinced their site is broken. Neither reaction is useful. Speed test results without context are just noise.
This guide breaks down what each tool actually measures, what the numbers mean for your specific WordPress setup, and — critically — what you should do when the test tells you something is wrong.
The Three Tools Worth Using (And What Each One Is For)
Not all speed tests measure the same thing. Using only one gives you a partial picture.
GTmetrix
GTmetrix runs a simulated browser load from a server location you choose and gives you both a performance grade and a waterfall chart. It's built on Google's Lighthouse engine but adds its own structure.
What it shows you that others don't: the full request waterfall. You can see exactly which resource loaded first, which one blocked rendering, and which third-party script added 1.2 seconds to your load time. For WordPress sites loaded with plugins — each injecting its own CSS, JS, and external calls — the waterfall is where the real damage becomes visible.
The GTmetrix grade (A through F) is directionally useful but don't fixate on it. A 72% score on a WooCommerce product page is a different problem from a 72% on a static landing page.
Key metric to track: Fully Loaded Time and Total Page Size. These tell you whether your performance issues are server-side (slow TTFB), render-side (render-blocking resources), or weight-side (unoptimized images, bloated scripts).
Google PageSpeed Insights
PageSpeed Insights pulls from Google's Lighthouse but — unlike GTmetrix — also shows you real-world CrUX data (Chrome User Experience Report). This is field data collected from actual users visiting your site, not a lab simulation.
That distinction matters enormously.
A lab test might give you a 90 on mobile. Your CrUX data might show that real users on 4G in your target market experience a 4.8-second Largest Contentful Paint. That gap — between what the simulation shows and what your actual visitors experience — is where most optimization efforts fall short.
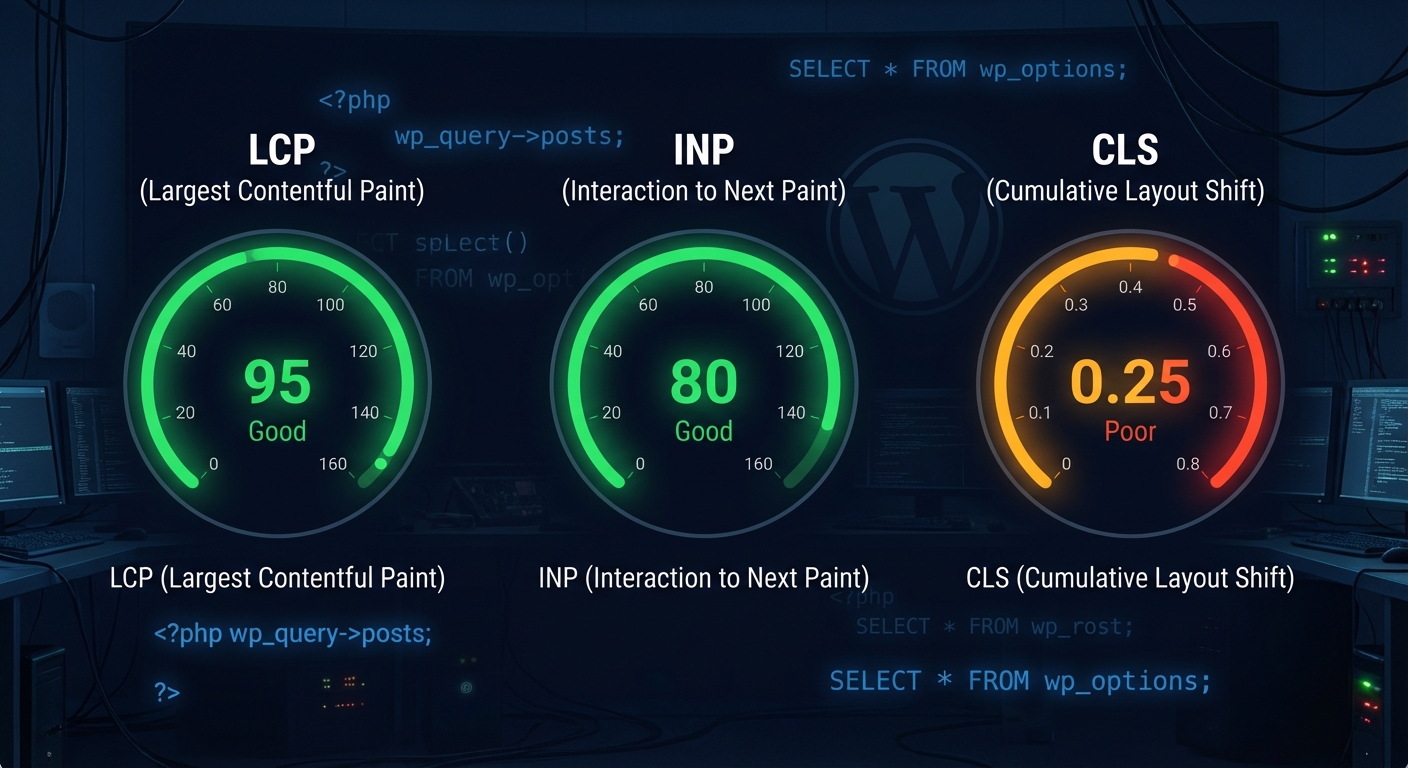
PageSpeed Insights reports on Core Web Vitals:
- LCP (Largest Contentful Paint): How long it takes for the main visible element to load. Google's threshold for "good" is under 2.5 seconds.
- INP (Interaction to Next Paint): Responsiveness to user input. Replaced FID in 2024.
- CLS (Cumulative Layout Shift): Whether elements jump around as the page loads. Anything above 0.1 is a problem.
- TTFB (Time to First Byte): How fast your server responds. If this is above 600ms, your hosting, PHP configuration, or object cache has a problem.
These four are the metrics Google uses as ranking signals. If you care about organic traffic, these are non-negotiable.
WebPageTest
WebPageTest is the tool developers use when they need surgical precision. It runs multi-step tests, supports scripted interactions (like adding a product to a WooCommerce cart), and exposes technical details like whether your site correctly uses HTTP/2, whether your server sends proper cache headers, and whether your CDN is actually serving assets from edge nodes or just passing through requests.
For most site owners, GTmetrix and PageSpeed Insights are sufficient. But if you're running performance-critical infrastructure — membership sites, high-traffic WooCommerce, course platforms — WebPageTest is where you go to confirm what's actually happening at the network layer.
What These Scores Don't Tell You
Here's the part that most speed optimization tutorials skip entirely.
Speed test scores measure the symptoms, not the causes. A poor LCP score means something loaded slowly — but it doesn't tell you whether the problem is:
- An unoptimized hero image served without WebP conversion
- A render-blocking CSS file your theme injects unconditionally
- A PHP process taking 800ms because the
wp_optionstable has 40000 autoloaded rows - A cron job that fires every 30 seconds and competes for server resources
- Object caching that isn't configured — so every page load hits the database from scratch
Those last two are the ones most "page speed" plugins never touch.
The wp_options table is a silent performance killer. Every plugin that stores options in the database — especially options marked as autoload = yes — adds to a payload that loads on every single page request, before your content renders. Across WordPress audits we perform, bloated autoloaded data is one of the most consistent and most overlooked performance factors we flag. No caching plugin fixes it.
Similarly, if your site runs without a persistent object cache (Redis or Memcached), WordPress queries the database repeatedly for the same data within a single page load. A speed test will report a slow TTFB. But the tool won't tell you the fix is configuring object caching at the server level — not installing another plugin.
Reading a GTmetrix Report Without Getting Lost
When you open a GTmetrix result, most people scroll straight to the "Recommendations" tab and panic about image optimization. Don't.
Start with this sequence:
1. Check TTFB first. If TTFB is above 500ms, everything else is downstream of a server or database problem. No front-end optimization will fix a slow backend. Check your PHP version — running PHP 7.4 on a site that supports 8.2 often produces measurable TTFB improvements just from the upgrade. Check whether your host supports OPcache.
2. Look at the waterfall for render-blocking resources. Third-party scripts — Google Tag Manager, chat widgets, analytics platforms, font loaders — are among the most common LCP killers on WordPress sites. They're invisible to most plugin-level optimization because they load externally. The waterfall makes them visible.
3. Check Time to Interactive vs. Fully Loaded. A site that loads visually in 1.8 seconds but doesn't become interactive until 6 seconds has a JavaScript execution problem — likely too many scripts loading synchronously, or a plugin registering multiple scripts that aren't deferred.
4. Don't optimize for the score. Optimize for the metric that affects your users. If your audience is primarily mobile users on slower connections, a desktop simulation score of 88 is meaningless. Test on the correct device profile and from a geographic region close to your users.
What "Passing" Core Web Vitals Actually Requires
Google's Core Web Vitals report in Search Console shows your site's status across three thresholds: Good, Needs Improvement, and Poor.
Most WordPress sites that self-report "good performance" are actually sitting in the "Needs Improvement" band for mobile. That's not failure — but it means Google may be applying ranking pressure you're not seeing in any single algorithmic update.
To consistently pass Core Web Vitals on a WordPress site:
- LCP requires your largest above-the-fold element to be preloaded correctly. Most page builders inject the hero image as a CSS background — which isn't preloadable. That one structural issue can push your LCP from 1.9s to 4.2s.
- CLS requires every image and embed to have explicit width and height attributes. WordPress has improved at this since 5.5, but themes and page builders still break it constantly.
- INP requires JavaScript execution efficiency. If a single plugin registers 14 scripts on every page load — including pages where those scripts are irrelevant — your INP suffers. Conditional script loading matters, and most WordPress setups don't do it.
The Role of Database Health in Your Speed Score
A speed test score reflects what happens at the browser. It doesn't show you what happens at the database layer before a single byte reaches the browser.
Database health directly affects TTFB — and TTFB is the foundation of every other metric. Before WordPress can render anything, it has to execute database queries. If those queries run against a table with poor indexing, or if the database is handling a flood of redundant queries because object caching isn't in place, your TTFB climbs regardless of how well you've optimized your images or minified your CSS.
Transients are part of this picture too. WordPress uses transients to cache temporary data — things like API responses and query results. When they expire and aren't cleaned up, they accumulate in the database as dead rows. That's overhead on every query that touches those tables. You won't see this flagged in any speed test report. It shows up as sluggishness that no plugin dashboard explains.
Running WP-CLI commands to audit database overhead — checking autoloaded option sizes, clearing expired transients, reviewing table health — is part of what a real performance audit looks like. It's not glamorous. It's not something a Lighthouse report tells you to do. But it's often the difference between a site that benchmarks at 2.1 seconds and one that benchmarks at 4.8 seconds on identical hardware.
What You Should Actually Do After Running a Speed Test
Running a speed test and reading the results takes ten minutes. Knowing what to fix — and in what order — is an entirely different skill set.
The typical mistake is treating every recommendation equally. GTmetrix might list 22 optimization opportunities. Most of them have negligible impact. Two of them account for 80% of your performance problem. The challenge is knowing which two.
Here's a prioritized diagnostic sequence:
- Establish your TTFB baseline. If it's above 500ms, fix this before anything else. Server-side issues always precede front-end optimization.
- Audit autoloaded data. Check
wp_optionsfor autoloaded row count and total payload size. If it's above 1MB, you have a maintenance problem, not just a performance problem. - Check transient accumulation. Expired transients that haven't been cleared add to query overhead. This doesn't surface in any speed test — but it slows down your backend.
- Audit JavaScript loading. Use Query Monitor to identify which plugins are injecting scripts on which pages. Disable or defer what isn't needed.
- Verify your caching stack is actually working. A misconfigured caching plugin is worse than no caching. Use a professional WordPress performance audit to confirm whether caching headers are being served correctly.
- Check image delivery. Are images served in WebP? Do they have correct
srcsetattributes? Are they lazy-loaded below the fold but eagerly loaded above it?
That sequence filters the noise from the actionable.
The Difference Between a Speed Test and an Audit
A speed test tells you something is slow. An audit tells you why — and what to fix first.
If you've run GTmetrix, stared at a 61 performance score, and aren't sure what to do next, that's not a knowledge problem. It's a prioritization problem. The tools surface symptoms. Interpreting them against a specific WordPress configuration — your theme, your plugin stack, your hosting environment, your database state — requires operational context.
Speed Tests Are a Starting Point, Not a Verdict
A score of 45 on mobile doesn't mean your site is unfixable. An 89 on desktop doesn't mean you have no problems. The numbers are directional. The real work is in the layer beneath the scores — the database queries, the script loading order, the caching configuration, the server response chain.
Most speed test guides will tell you to install a caching plugin and compress your images. That's not wrong — it's just incomplete. The sites that consistently perform well aren't running more plugins. They're running leaner configurations, maintained regularly, with someone who understands what autoloaded wp_options rows look like at 3AM when a cron job fires and nobody's watching.